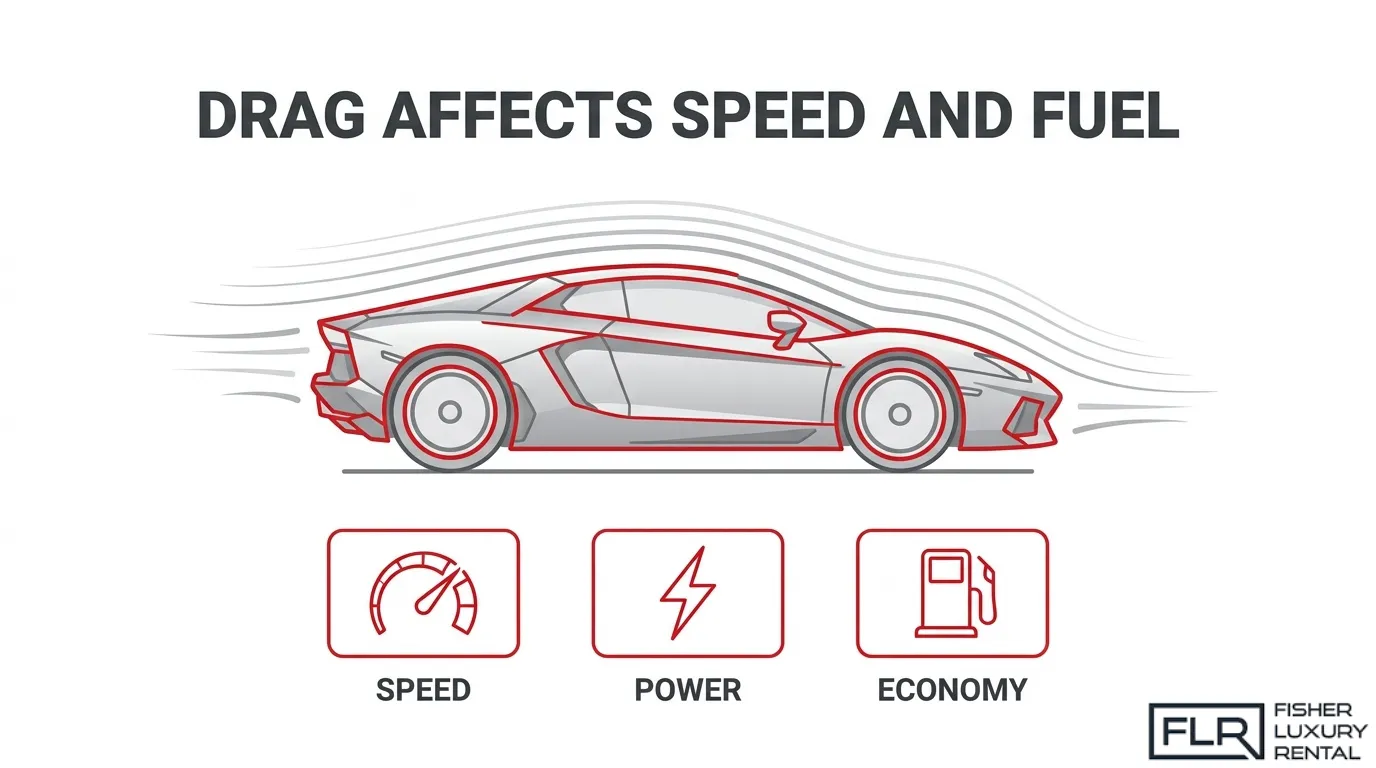
Aerodynamic drag is the resistive force air exerts on a moving vehicle, opposing forward motion and consuming engine power at a rate that grows with the square of vehicle speed.
This guide covers the physics of drag, how it limits speed and acceleration across vehicle types, its fuel economy consequences at highway speeds, the role it plays in electric vehicle range, and how automakers and drivers can reduce it.
Drag originates from four distinct force types: form drag, skin friction drag, induced drag, and interference drag. Understanding each reveals why body shape is the single most impactful design variable engineers can optimize, and why even small exterior additions produce disproportionately large resistance penalties.
Because drag scales with velocity squared, its consequences grow sharply at speed. At 70 mph, overcoming aerodynamic drag accounts for roughly 65% of total energy expenditure in a typical highway vehicle, a share that explains why top speed ceilings, acceleration curves, and fuel consumption all tie directly back to aerodynamic efficiency.
Modern automakers counter drag through active grille shutters, rear diffusers, streamlined body sculpting, and aerodynamic wheel treatments, each trimming the drag coefficient incrementally. Driving habits and wind conditions shift that equation further: an 18 mph headwind produces a 17% MPG loss, while an 18 mph tailwind delivers a 19% MPG gain under steady cruising conditions.
For electric vehicles, drag carries additional weight. A simulation of a Nissan Leaf at true highway speeds found a 36.2% range loss attributable to aerodynamic resistance alone, illustrating how severely drag compounds when there is no fuel tank to absorb the shortfall.
What Is Aerodynamic Drag on a Vehicle?
Aerodynamic drag is the resistive force that air exerts on a vehicle as it moves forward, opposing motion and consuming engine power. It is one of the dominant energy loads a vehicle faces, particularly at highway speeds.
According to the National Research Council, aerodynamic drag accounted for 56% of tractive energy for a high-drag vehicle (typical of a truck or SUV), 54% for a mid-range vehicle, and 47% for a lower-drag vehicle under highway driving cycle estimates. That share of energy loss makes drag reduction one of the highest-leverage factors in vehicle efficiency and performance engineering.
What Are the Main Types of Drag Acting on a Vehicle?
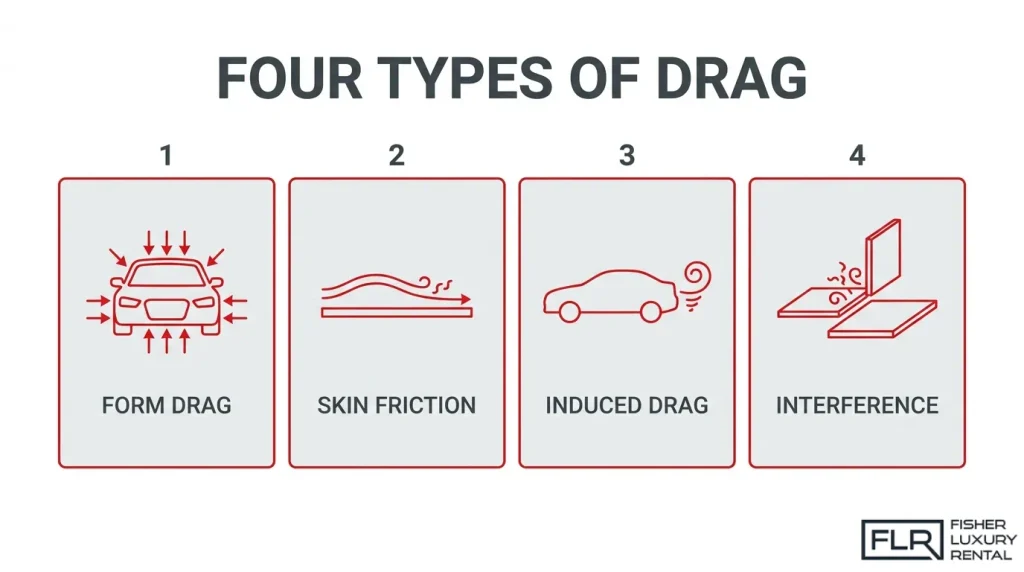
The main types of drag acting on a vehicle are form drag, skin friction drag, induced drag, and interference drag. According to NASA Glenn Research Center, the drag coefficient bundles all four components into a single measurable value used in the drag equation.
Form Drag
Form drag is caused by the net pressure difference between the forward-facing and rearward-facing surfaces of a vehicle’s body. As air strikes the front of the vehicle, high pressure builds up, while a low-pressure wake forms behind it. The larger and blunter the body shape, the greater this pressure imbalance and the higher the resulting form drag. Among all drag types, form drag is the dominant force acting on most road vehicles, making body shape the single most impactful design variable engineers can optimize.
Skin Friction Drag
Skin friction drag is caused by viscosity in the boundary layer acting across the vehicle’s surface. As air flows along body panels, roof, hood, and underbody, it clings to the surface, creating a thin shear layer that resists motion. Virginia Tech’s aerodynamics reference defines it as drag produced “by the action of viscosity in the boundary layer on the surface of a body.” Smoother, cleaner surfaces reduce this effect, which is why modern vehicles use flush-mounted glass, smooth underbody panels, and painted surfaces with minimal texture.
Induced Drag
Induced drag is caused by vorticity shed behind a lifting surface, such as the vortex wake that forms at the rear of a vehicle generating aerodynamic downforce. When a spoiler or diffuser produces downforce, it also generates trailing vortices that add drag as a byproduct. This trade-off is central to performance vehicle design: more downforce typically means more induced drag, so engineers balance grip with aerodynamic efficiency.
Interference Drag
Interference drag is drag generated where two surfaces or airflow streams meet and interact, such as where a side mirror meets the door panel, or where the roof meets the A-pillar. These junctions disrupt smooth airflow and create additional turbulent resistance beyond what each surface would produce independently. Understanding interference drag explains why even small exterior additions, like roof racks or external fixtures, can disproportionately increase total vehicle drag.
What Causes Aerodynamic Drag on Cars?
Aerodynamic drag on cars originates from several physical sources, including vehicle shape, exterior features, ride height, and underbody geometry. The following sections examine how each factor contributes to total drag force.
How Does Vehicle Shape Influence Drag?
Vehicle shape influences drag by determining how smoothly airflow attaches to and separates from the body. Blunt, upright profiles create large low-pressure wakes behind the vehicle, dramatically increasing form drag compared to tapered, sloped body designs. Rooftop add-ons illustrate this clearly: according to a wind-tunnel study published via the University of South Carolina Scholar Commons, a roof rack alone raised the drag coefficient by 20.4% over a baseline Cd of 0.4, while a roof rack loaded with a ladder increased it by 24%, and a barrel-shaped load pushed that increase to 33.1%. Even modest additions matter; a taxi sign added 5.1% and an advertisement sign added 7.2%. These numbers reinforce a fundamental principle: any geometry that disrupts smooth airflow over the roofline creates a disproportionately large drag penalty.
How Do Side Mirrors and Exterior Features Add Drag?
Side mirrors and exterior features add drag by protruding into the airstream and generating localized turbulence and pressure imbalances around the vehicle body. A mirror that produces 1 pound of drag in free air can generate 1.6 pounds when mounted near the vehicle body, a 60% increase, because the proximity effect amplifies the interference between the mirror’s wake and the surrounding bodywork. Spoilers, antennas, door handles, and body moldings contribute similarly, each creating small separation zones that accumulate into measurable total drag. From an engineering perspective, even components that appear aerodynamically minor rarely are; the cumulative effect of multiple small protrusions frequently rivals the drag impact of an entirely different body style.
How Does Ride Height Affect Airflow and Drag?
Ride height affects airflow and drag by controlling how much air is channeled underneath the vehicle. A higher ride height allows a greater volume of turbulent, undirected airflow to pass beneath the chassis, increasing drag and reducing the beneficial ground-effect pressure differential that flatter underbodies create. West Texas A&M University’s research on air friction and fuel economy notes that managing the airflow path is central to why drag directly reduces mileage. Lowering ride height compresses this underbody channel, forcing air to accelerate more smoothly around the sides and over the top of the vehicle rather than creating chaotic turbulence beneath it.
How Does Underbody Design Contribute to Drag?
Underbody design contributes to drag through surface roughness, exposed mechanical components, and unmanaged airflow paths beneath the chassis. Exhaust systems, suspension arms, fuel tanks, and cross-members all act as turbulence generators, trapping air and preventing the laminar flow that a smooth underpanel would enable. A flat, sealed underbody reduces these disruptions by presenting a continuous surface that guides air cleanly from nose to tail. Research published in the SAE International Journal of Advances and Current Practices in Mobility found that production underbody treatments, air dams, and ride height reduction work together to redirect incoming flow away from turbulent underbody regions toward smoother exterior surfaces, confirming that underbody geometry is one of the highest-leverage areas for total drag reduction.
What Is the Drag Coefficient and Why Does It Matter?
The drag coefficient is a dimensionless number that quantifies how much aerodynamic resistance a vehicle’s shape produces as it moves through air. A lower value means the vehicle pushes through air more efficiently, directly affecting speed, fuel economy, and performance. The sub-sections below trace how the drag coefficient is measured and how it has evolved across a century of automotive design.
How Is the Drag Coefficient Measured?
The drag coefficient is measured by testing a vehicle in a wind tunnel and applying the drag equation, where drag force equals the drag coefficient multiplied by air density, half the velocity squared, and the vehicle’s frontal reference area. According to NASA Glenn Research Center, the drag coefficient captures all contributing resistance forces, including form drag, skin friction drag, wave drag, and induced drag. Wind tunnel testing isolates each variable, allowing engineers to calculate a precise Cd value for any body shape.
What Is a Good Drag Coefficient for a Car?
A good drag coefficient for a car falls below 0.30 for modern production vehicles designed with aerodynamics as a primary engineering parameter. A NASA Technical Reports Server study found that zero-yaw drag coefficients in a tested group of electric, hybrid, and subcompact vehicles ranged from a low of approximately 0.34 for an aerodynamically integrated four-passenger prototype to a high of 0.58 for a boxy delivery van and an open roadster. Production sedans and EVs today typically target the lower end of that range.
How Has the Average Drag Coefficient Changed Over Time?
The average drag coefficient has fallen dramatically over the past century of automotive engineering. A NASA Technical Reports Server report documents that the average production car carried a Cd of approximately 0.8 in the early 1920s, which dropped to about 0.6 by 1940 and to roughly 0.5 by 1960. Advances in computational fluid dynamics and wind tunnel testing have since pushed modern vehicles well below those benchmarks, making aerodynamic efficiency a standard design goal rather than a specialty consideration.
How Does Drag Affect a Vehicle’s Top Speed?
Drag limits top speed differently across vehicle types, depending on body shape, frontal area, and drag coefficient. The sections below cover how this plays out in sports cars, SUVs and trucks, and sedans.
How Does Drag Limit Top Speed in Sports Cars?
Drag limits top speed in sports cars by creating a resistance force that grows faster than the engine’s ability to overcome it. Because aerodynamic drag is proportional to the square of vehicle speed, doubling speed quadruples drag force. At peak velocity, engine output and drag reach equilibrium, setting a hard ceiling on how fast the car can go.
Sports car engineers treat this ceiling as a design variable. Low-slung bodies, rear diffusers, and active aerodynamic elements reduce drag coefficient to push that ceiling higher. According to the New York State Department of Transportation, citing EPA data, every 5 mph above 60 mph is equivalent to paying 20 extra cents per gallon for gas, illustrating just how sharply drag costs rise with speed.
The practical takeaway: a meaningful reduction in drag coefficient directly raises the achievable top speed, which is why aerodynamics engineering is central to exotic car development.
How Does Drag Limit Top Speed in SUVs and Trucks?
Drag limits top speed in SUVs and trucks more severely than in any other common vehicle class, primarily because of their large frontal area and boxy body shape. A large frontal area multiplies the drag force acting on the vehicle at any given speed, requiring far more power to sustain highway velocities.
At 70 mph, overcoming aerodynamic drag represents approximately 65% of total energy expenditure for a typical heavy truck, according to the U.S. Department of Energy and Lawrence Livermore National Laboratory. In National Research Council highway cycle estimates, aerodynamic drag accounted for 56% of tractive energy for the high-vehicle category, described as typical of a truck or SUV. These figures explain why SUVs and trucks reach their top speed plateaus at lower absolute speeds than sports cars despite sometimes comparable engine output.
How Does Drag Limit Top Speed in Sedans?
Drag limits top speed in sedans through a combination of moderate drag coefficients and mid-range frontal area. Sedans occupy a middle ground between the optimized profiles of sports cars and the blunt geometry of SUVs, giving them respectable top speeds but generally lower ceilings than purpose-built performance vehicles.
A sloped roofline and integrated trunk help sedans shed airflow more efficiently than trucks, but the upright greenhouse and flat underbody of most production models still generate meaningful drag at highway speeds. Manufacturers address this through flush door handles, active grille shutters, and underbody panels, each trimming the drag coefficient incrementally to raise the practical top speed ceiling.
How Does Drag Reduce a Vehicle’s Acceleration?
Drag reduces a vehicle’s acceleration by opposing the engine’s forward thrust, forcing the powertrain to overcome resistive force before converting output into forward motion. The sections below explain how drag force scales with speed during acceleration and how it varies across vehicle types.
How Does Drag Force Increase as a Car Accelerates?
Drag force increases as a car accelerates because aerodynamic drag is proportional to the square of vehicle speed. Doubling speed quadruples the drag load the engine must overcome, according to the Federal Register. At low speeds, this aerodynamic penalty is modest. As velocity climbs, however, drag consumes an ever-larger share of available engine power, leaving progressively less thrust to produce additional acceleration. This is why even high-horsepower vehicles experience a noticeably flattening acceleration curve at higher speeds.
How Does High Drag Affect 0-60 Times in Performance Cars?
High drag affects 0-60 times in performance cars by raising the resistive load the drivetrain must defeat at every stage of the acceleration run. Below roughly 30 mph, tire grip and drivetrain limits tend to govern. Above that threshold, aerodynamic drag rises sharply with speed and begins constraining how quickly available power translates into velocity gain. Engineers balance downforce against drag specifically because designs that generate grip-boosting downforce often increase drag simultaneously, creating a direct trade-off between cornering stability and straight-line acceleration.
How Does Drag Slow Acceleration in SUVs and Trucks?
Drag slows acceleration in SUVs and trucks more severely than in low-profile vehicles because their larger frontal area multiplies the aerodynamic resistive force at any given speed. The National Research Council found that aerodynamic drag accounts for 47 to 56% of tractive energy in highway driving for trucks and SUVs. That substantial energy share, claimed by drag before the wheels can accelerate the vehicle, directly explains the longer 0-60 times characteristic of high-frontal-area platforms. Reducing ride height or adding underbody panels helps reclaim some of that lost acceleration potential.
How Does Drag Impact Fuel Economy at Highway Speeds?
Drag impacts fuel economy at highway speeds by forcing the engine to work harder against air resistance that grows exponentially with speed. The following sections cover how drag penalties compound at 60 MPH, how they escalate further at 80 MPH, and how wind resistance compares to rolling resistance as a fuel cost.
How Much Extra Fuel Does Drag Consume at 60 MPH?
Extra fuel consumed by drag at 60 MPH is significant enough that the EPA equates every 5 mph above 60 mph to paying 20 extra cents per gallon for gas. According to the New York State Department of Transportation, observing the speed limit and staying at or below 60 mph can improve mileage by 7 to 23 percent. At this threshold, aerodynamic drag begins overtaking other resistance forces as the dominant energy draw, making 60 mph the practical tipping point for fuel-conscious driving.
How Much Extra Fuel Does Drag Consume at 80 MPH?
Extra fuel consumed by drag at 80 MPH rises sharply because aerodynamic drag scales with the square of vehicle speed. Doubling speed from 40 to 80 mph quadruples drag force, meaning the engine must overcome four times as much air resistance. A U.S. Department of Transportation simulation found that a Nissan Leaf loses 36.2% of its range at true highway speeds, even without accounting for road grade or wind conditions, illustrating how aggressively drag strips energy reserves above 70 mph.
How Does Wind Resistance Compare to Rolling Resistance?
Wind resistance compares to rolling resistance by becoming the larger fuel cost at highway speeds, while rolling resistance dominates at lower urban speeds. Aerodynamic drag is proportional to the square of vehicle speed, so its share of total road load grows rapidly as speed increases. At 70 mph, aerodynamic drag accounts for roughly 65% of total energy expenditure for a typical vehicle, according to the U.S. Department of Energy, leaving rolling resistance as a secondary factor at sustained highway cruise.
Understanding this relationship helps explain why even modest speed reductions can meaningfully extend range and reduce fuel costs on long highway trips. For drivers curious about how aerodynamic efficiency feels at the wheel, Fisher Luxury Rental’s exotic and luxury fleet in Phoenix and Portland offers the chance to experience purpose-built low-drag vehicles firsthand.
How Does Speed Influence the Amount of Drag a Car Faces?
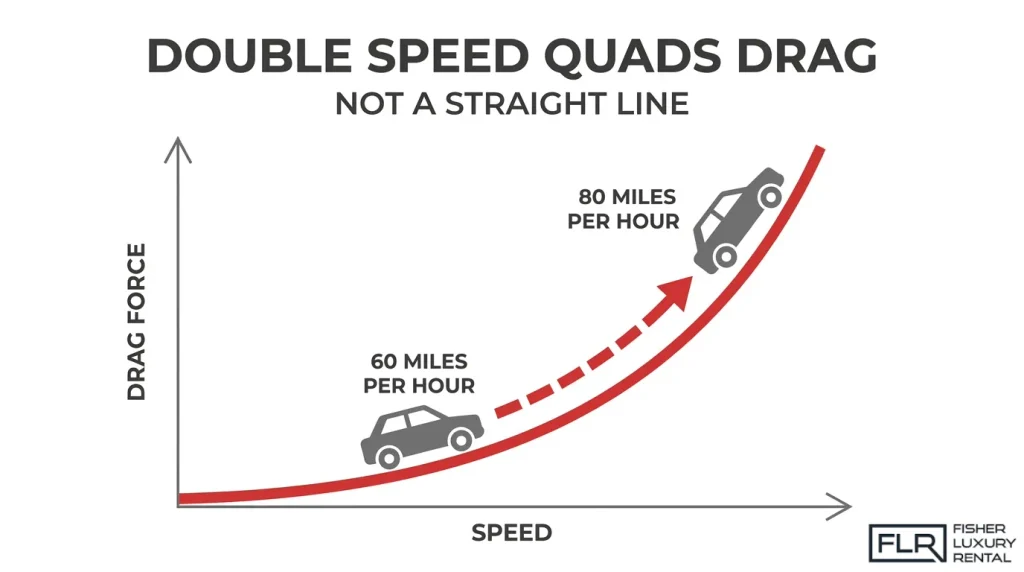
Speed influences the amount of drag a car faces through a squared relationship: doubling a car’s speed quadruples the aerodynamic drag force acting against it. According to the Federal Register, aerodynamic drag is proportional to the square of vehicle speed. The sections below explain the drag equation, how drag forces scale at highway speeds, and what that means for engine demand.
How Does the Drag Equation Explain the Speed-Squared Relationship?
The drag equation explains the speed-squared relationship by defining drag force as the drag coefficient multiplied by air density, multiplied by half the velocity squared, multiplied by the vehicle’s reference area. NASA Glenn Research Center states this relationship directly: D = Cd × r × (V²/2) × A. The velocity-squared term is the critical factor. Because velocity is squared, a car traveling at 80 mph faces roughly 78% more drag force than the same car at 60 mph, not 33% more as a linear scale might suggest.
How Do Drag Forces Scale From City Speeds to Highway Speeds?
Drag forces scale from city speeds to highway speeds exponentially, not gradually. At low city speeds, rolling resistance dominates total road load. As speed climbs into highway ranges, the squared velocity term causes aerodynamic drag to overtake rolling resistance as the primary opposing force. According to the U.S. Department of Energy and Lawrence Livermore National Laboratory, at 70 mph, overcoming aerodynamic drag represents approximately 65% of total energy expenditure for a typical heavy vehicle. For passenger cars, the crossover point arrives at lower speeds, making aerodynamic efficiency far more consequential on highways than in city driving.
Why Does High Speed Demand More Engine Power to Overcome Drag?
High speed demands more engine power to overcome drag because power required to maintain constant velocity against drag scales with the cube of speed, not the square. If drag force grows with V², the power needed to sustain that speed against drag grows with V³. This means an engine working to hold 90 mph is not working proportionally harder than at 60 mph; it is working dramatically harder. That exponential engine-load increase explains why fuel consumption rises so steeply at elevated highway speeds, a relationship that matters most in high-performance vehicles built to operate near their aerodynamic limits.
What Role Does Drag Play in Electric Vehicle Range?
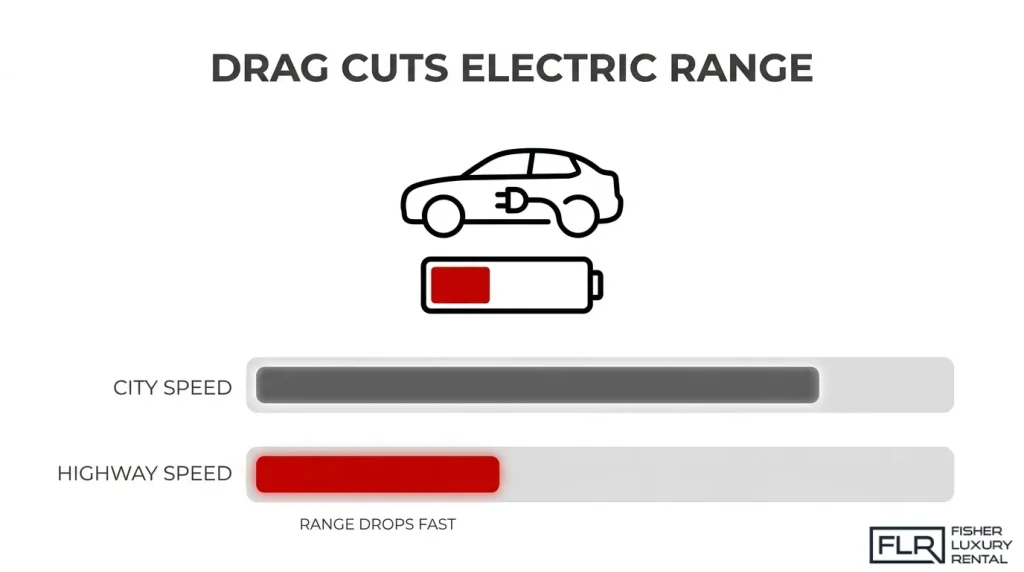
Drag plays a direct role in electric vehicle range by forcing the battery to expend more energy overcoming air resistance, particularly at highway speeds. The sections below examine how EV aerodynamics differ from conventional vehicles and how drag coefficients determine real-world range loss.
How Does Aerodynamic Drag Reduce EV Battery Range?
Aerodynamic drag reduces EV battery range by converting stored electrical energy into heat rather than forward motion, a penalty that grows sharply as speed increases. Because EVs carry no onboard fuel to compensate, every unit of energy lost to drag directly shortens the distance the vehicle can travel on a single charge.
A U.S. Department of Transportation simulation found that a Nissan Leaf loses 36.2% of its range at true highway speeds, without even accounting for road grade or wind conditions. That figure illustrates how severely drag compounds at sustained high speeds compared to the gentler city cycles used in official EPA range estimates. For EV drivers, maintaining moderate highway speeds is one of the most effective range-preservation strategies available.
What Drag Coefficients Do Electric Vehicles Achieve?
The drag coefficients electric vehicles achieve vary widely depending on design intent and body style. A U.S. Department of Commerce wind-tunnel study that tested sixteen electric, hybrid, and subcompact production vehicles found zero-yaw drag coefficients ranging from a high of 0.58 for a boxy delivery van and an open roadster to a low of approximately 0.34 for a four-passenger prototype specifically designed with aerodynamics as an integrated parameter.
That 0.24-point spread between the best and worst performers is significant. At highway speeds, the difference in energy consumption between a Cd of 0.58 and 0.34 is substantial enough to affect range by tens of miles per charge. Purpose-built aerodynamic EV design is not cosmetic: it is a functional range multiplier. Fisher Luxury Rental’s fleet focuses on top-trim models selected for their performance engineering, giving drivers access to vehicles where aerodynamic development is a genuine design priority rather than an afterthought.
How Do Automakers Reduce Drag in Modern Vehicle Design?
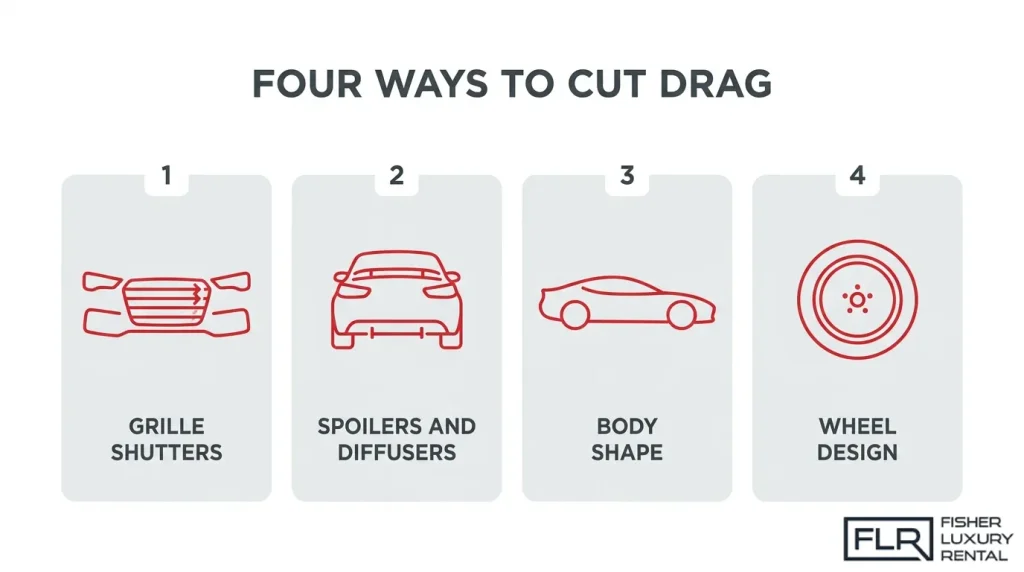
Automakers reduce drag through a combination of active systems, body geometry, and wheel treatments. The H3s below cover active grille shutters, rear spoilers and diffusers, streamlined body sculpting, and wheel design.
According to a NASA Technical Reports Server report, the drag coefficient of the average production car was about 0.8 in the early 1920s, dropped to roughly 0.6 by 1940, and fell further to about 0.5 by 1960, demonstrating that aerodynamic progress is both measurable and continuous.
How Do Active Grille Shutters Lower Drag?
Active grille shutters lower drag by closing off the front grille opening when engine cooling demand is low, redirecting incoming airflow away from the turbulent engine bay and toward smoother exterior surfaces. A full-scale, multi-vehicle light-duty study published in the SAE International Journal of Advances and Current Practices in Mobility found that closing grille shutters, sealing the external grille, and lowering ride height collectively reduce drag by redirecting flow from the engine bay or underbody toward cleaner aerodynamic paths above and around the vehicle. Pairing shutters with an air dam and underbody treatments compounds the benefit further. This makes active grille shutters one of the most cost-effective drag-reduction tools available to production engineers.
How Do Rear Spoilers and Diffusers Manage Airflow?
Rear spoilers and diffusers manage airflow by controlling the low-pressure wake that forms behind a moving vehicle. A spoiler disrupts turbulent separation at the roofline, while a diffuser gradually expands underbody airflow, raising its pressure before it exits and reducing the suction that pulls the car backward. A review published in Heliyon found that an optimized rear flap reduced drag by 6.3%, an optimized diffuser reduced drag by 5.4%, and combining both devices yielded a 7.4% reduction on the studied body. The combined gain being less than the sum of the individual gains shows that these devices interact aerodynamically, so tuning them as a system matters.
How Does Streamlined Body Sculpting Cut Drag?
Streamlined body sculpting cuts drag by shaping the vehicle so air flows smoothly from the nose, over the greenhouse, and off the tail without separating into turbulent eddies. Key techniques include a raked windshield angle, flush-mounted glass, tapered rear pillars, and carefully radiused body edges that maintain an attached boundary layer. The NASA Technical Reports Server report noted that even a sideview mirror’s drag rose 60% when placed near the vehicle body versus free air, illustrating how local surface geometry amplifies drag on even small components. Designers who treat the entire silhouette as a continuous aerodynamic surface consistently achieve lower coefficients than those who address components in isolation.
How Do Wheel Design and Covers Reduce Turbulence?
Wheel design and covers reduce turbulence by minimizing the chaotic airflow generated as open spokes and brake cavities rotate at highway speed. Flush or partially covered wheels reduce the air pumped outward from the wheel well, lowering both form drag and interference drag at the wheel arch. Aerodynamic wheel covers, narrower tire profiles, and smooth-face alloy designs all serve this goal. Wheel treatments are frequently included in multi-device aerodynamic packages, where their contribution combines with underbody panels and ride-height adjustments for measurable system-level drag reductions.
How Do Driving Habits Affect the Drag Your Car Experiences?
Driving habits directly affect the drag your car experiences by changing speed, which exponentially increases aerodynamic resistance. How you drive, including your cruising speed and sensitivity to wind conditions, determines how much drag works against your vehicle on every trip.
How Does Your Cruising Speed Change the Drag You Face?
Your cruising speed changes the drag you face significantly, because aerodynamic drag grows with the square of velocity. Driving faster does not linearly increase resistance; it multiplies it. According to the EPA, observing speed limits and staying at or below 60 mph can improve mileage by 7 to 23 percent, with every 5 mph above 60 equivalent to paying roughly 20 extra cents per gallon of fuel. At higher cruising speeds, the engine must overcome dramatically greater aerodynamic forces, reducing both performance headroom and efficiency. For drivers accustomed to spirited highway driving, this relationship is easy to underestimate. Choosing a steady, moderate cruising speed is one of the most impactful aerodynamic decisions a driver can make.
How Does Driving Into a Headwind Increase Drag?
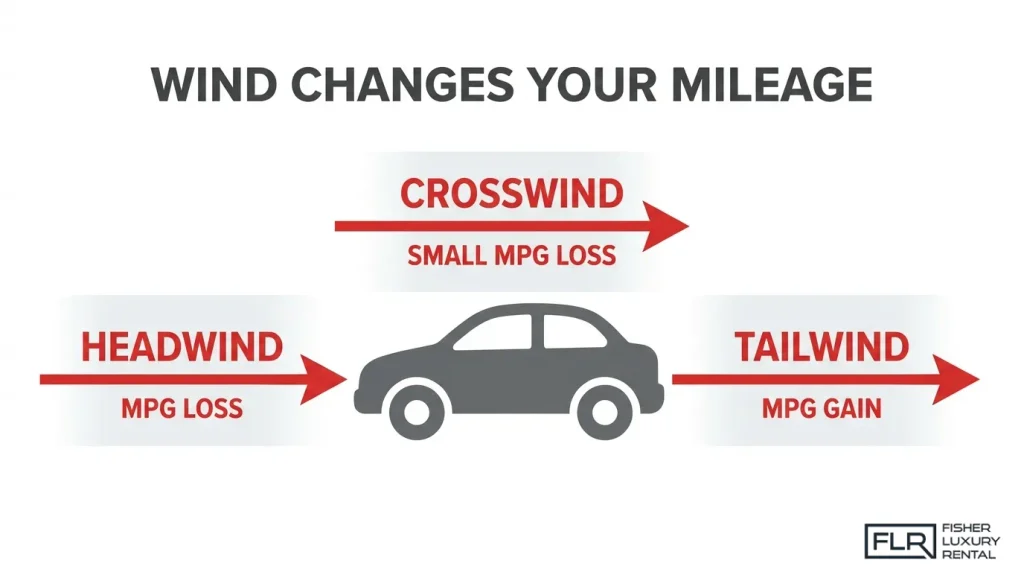
Driving into a headwind increases drag by adding effective wind velocity on top of road speed, forcing the vehicle to push through a denser, faster-moving air mass. Based on EPA data from steady-speed cruising at approximately 50 mph, an 18 mph headwind produces a 17% MPG loss, while an 18 mph tailwind produces a 19% MPG gain, and an 18 mph crosswind produces a comparatively modest 2% MPG loss. These figures illustrate how wind direction, not just vehicle design, meaningfully shifts the drag equation in real-world driving. Routing choices and awareness of prevailing wind conditions are practical tools any driver can use to manage aerodynamic load.
How Does Weather and Wind Affect Drag on the Road?
Weather and wind affect drag by changing the effective airspeed a vehicle experiences, directly altering the aerodynamic load. The sections below cover headwind, crosswind, and tailwind effects on fuel economy and the broader role of ambient wind speed.
How Does a Headwind Increase Drag and Reduce Fuel Economy?
A headwind increases drag by adding to the vehicle’s effective airspeed, forcing the engine to overcome a larger aerodynamic load. According to EPA data, an 18 mph headwind at steady-speed cruising near 50 mph produces a 17% loss in MPG. That is a substantial penalty from a force most drivers never see. The Federal Register also notes that wind effects reduce on-road fuel economy by an average of 5 to 6 percent when calculated using the U.S. average wind speed of 9.4 mph, confirming that ambient wind alone, even without gusts, meaningfully erodes efficiency on every highway trip.
How Does a Tailwind Reduce Drag and Improve Fuel Economy?
A tailwind reduces drag by narrowing the speed differential between the vehicle and surrounding air, lowering the effective aerodynamic load on the body. EPA data shows that an 18 mph tailwind at approximately 50 mph produces a 19% gain in MPG, slightly larger in magnitude than the headwind penalty. This asymmetry reflects the nonlinear nature of the drag equation: small changes in relative airspeed produce disproportionate changes in drag force.
How Does a Crosswind Affect Vehicle Drag and Stability?
A crosswind affects vehicle drag by introducing a yaw angle between the vehicle centerline and the oncoming airflow, increasing the effective frontal area and generating side force. Interestingly, EPA data indicates an 18 mph crosswind produces only a 2% MPG loss at steady cruise, far less than a direct headwind. However, the drag impact of crosswinds is not fully captured under standard test conditions. Research published in Transportation Research Part D notes that much drag-reduction device testing “was done in direct flow neglecting how the devices perform in a crosswind,” meaning real-world crosswind drag penalties may be underestimated in published efficiency figures.
How Should You Think About Drag When Choosing a Luxury Rental?
Drag shapes every performance metric that matters in a luxury or exotic car: top speed, acceleration response, and fuel range. The H3s below connect aerodynamic principles directly to the rental experience and summarize the article’s key takeaways.
Can Renting an Exotic Car from Fisher Luxury Rental Help You Experience Low-Drag Performance Firsthand?
Yes, renting an exotic car from Fisher Luxury Rental can help you experience low-drag performance firsthand. Vehicles in Fisher Luxury Rental’s exotic fleet are engineered with aerodynamic precision – sculpted bodywork, managed underbody flow, and optimized profiles that reduce drag and translate directly into sharper throttle response and higher sustained speeds.
Fisher Luxury Rental stocks top-trim models of every vehicle in its fleet, serving Phoenix, Scottsdale, Portland, and Vancouver, WA. That means you’re not driving a compromised variant where cost-cutting affected the aerodynamic package. The difference between reading about a low drag coefficient and feeling it through the seat at highway speed is considerable – this is the kind of sensory education that no specification sheet can replicate.
What Are the Key Takeaways About How Drag Affects Speed, Performance & Fuel Economy?
The key takeaways about how drag affects speed, performance, and fuel economy center on one governing principle: drag scales with the square of vehicle speed, making it exponentially more costly the faster you drive.
The most actionable findings from the research are:
- Drag dominates at speed. According to a U.S. Department of Energy and Lawrence Livermore National Laboratory report, at 70 mph aerodynamic drag accounts for roughly 65% of total energy expenditure in a typical highway vehicle.
- Wind direction moves the needle significantly. The EPA found that an 18 mph headwind at steady cruising speed produces a 17% MPG loss, while an 18 mph tailwind produces a 19% MPG gain.
- Low-drag design is a real performance differentiator. Exotic manufacturers invest heavily in aerodynamic development precisely because every reduction in drag coefficient directly raises attainable top speed and preserves range.
Understanding drag transforms how you evaluate any vehicle, whether you’re analyzing a purchase or selecting a rental for a weekend drive.